Outcomes Data Visualization Module
Showcase your historical outcomes data
Inspire current and prospective students with historical outcomes data that shows them how a degree from your institution translates to the real world.
The Problem
Students are skeptical of the value of a college degree
College is a huge investment. Students (and parents) want to feel confident in the ROI of a degree from your institution. But many have a hard time visualizing how that education could apply to life after college.
The Solution
Prove ROI with real-world outcomes data
Inspire students and parents by publicly sharing your outcomes data so they can see exactly what your alumni have gone on to do—including where they work, what degrees they earned, how much money they make, etc.
Features
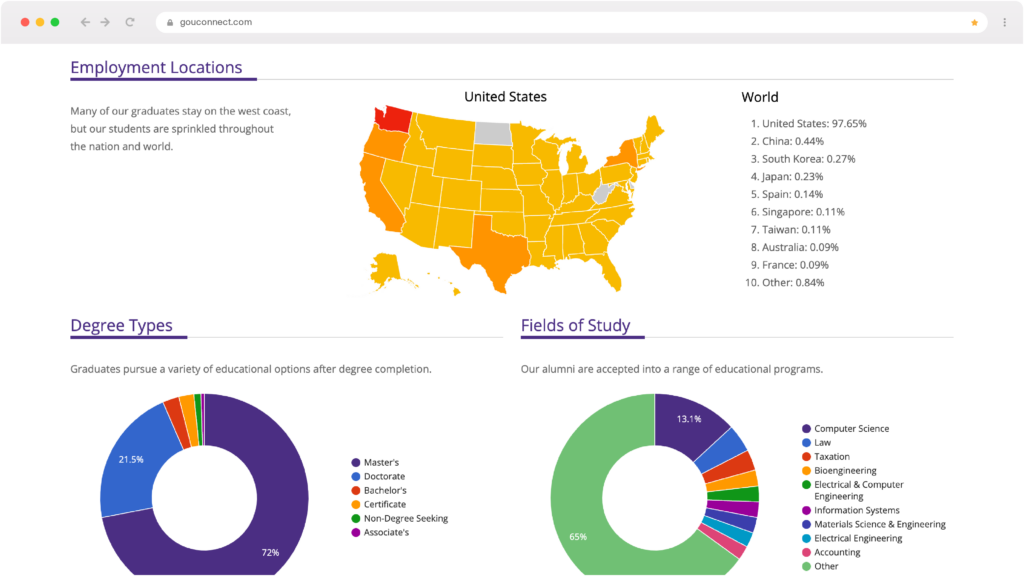
Highlight your school’s historical outcomes to help current and prospective students visualize their own future career pathways.
Leverage data you already have
uConnect’s outcomes data visualization module makes your data easier to interpret—whether it’s NACE’s First-Destination Survey data, alumni outcomes data, or even workforce data for adult learners. Filter by graduation year, major, or identity/affinity so students (and parents) can see what your graduates have achieved.
Highlight the value of a degree from your institution
Students want to know who they can work for, what jobs are available (and how much they pay), and where they might need to live for those opportunities. This module helps you do it all.
Keep current students engaged
With real-world outcomes data right at their fingertips, current students can pursue their education with the confidence that what they learn will be valued in the workforce. From enrollment to graduation, the outcomes data visualization module will help inform, inspire, and retain your students.
uConnect’s outcomes data visualization makes it possible for us to share this valuable information in a format that’s easy to interpret and accessible to all university constituents.
Our admissions team can share the data directly with prospective students and their families so they can visualize a path to life after Wentworth and feel confident in their investment. And current students can research the career paths of previous Wentworth students from their major.
Abbey Pober
Associate Director of the Center for Cooperative Education and Career Development at Wentworth Institute of Technology

Highlight your outcomes data to support students and prove ROI.
Fill out the form to learn how to add the Outcomes Data Visualization